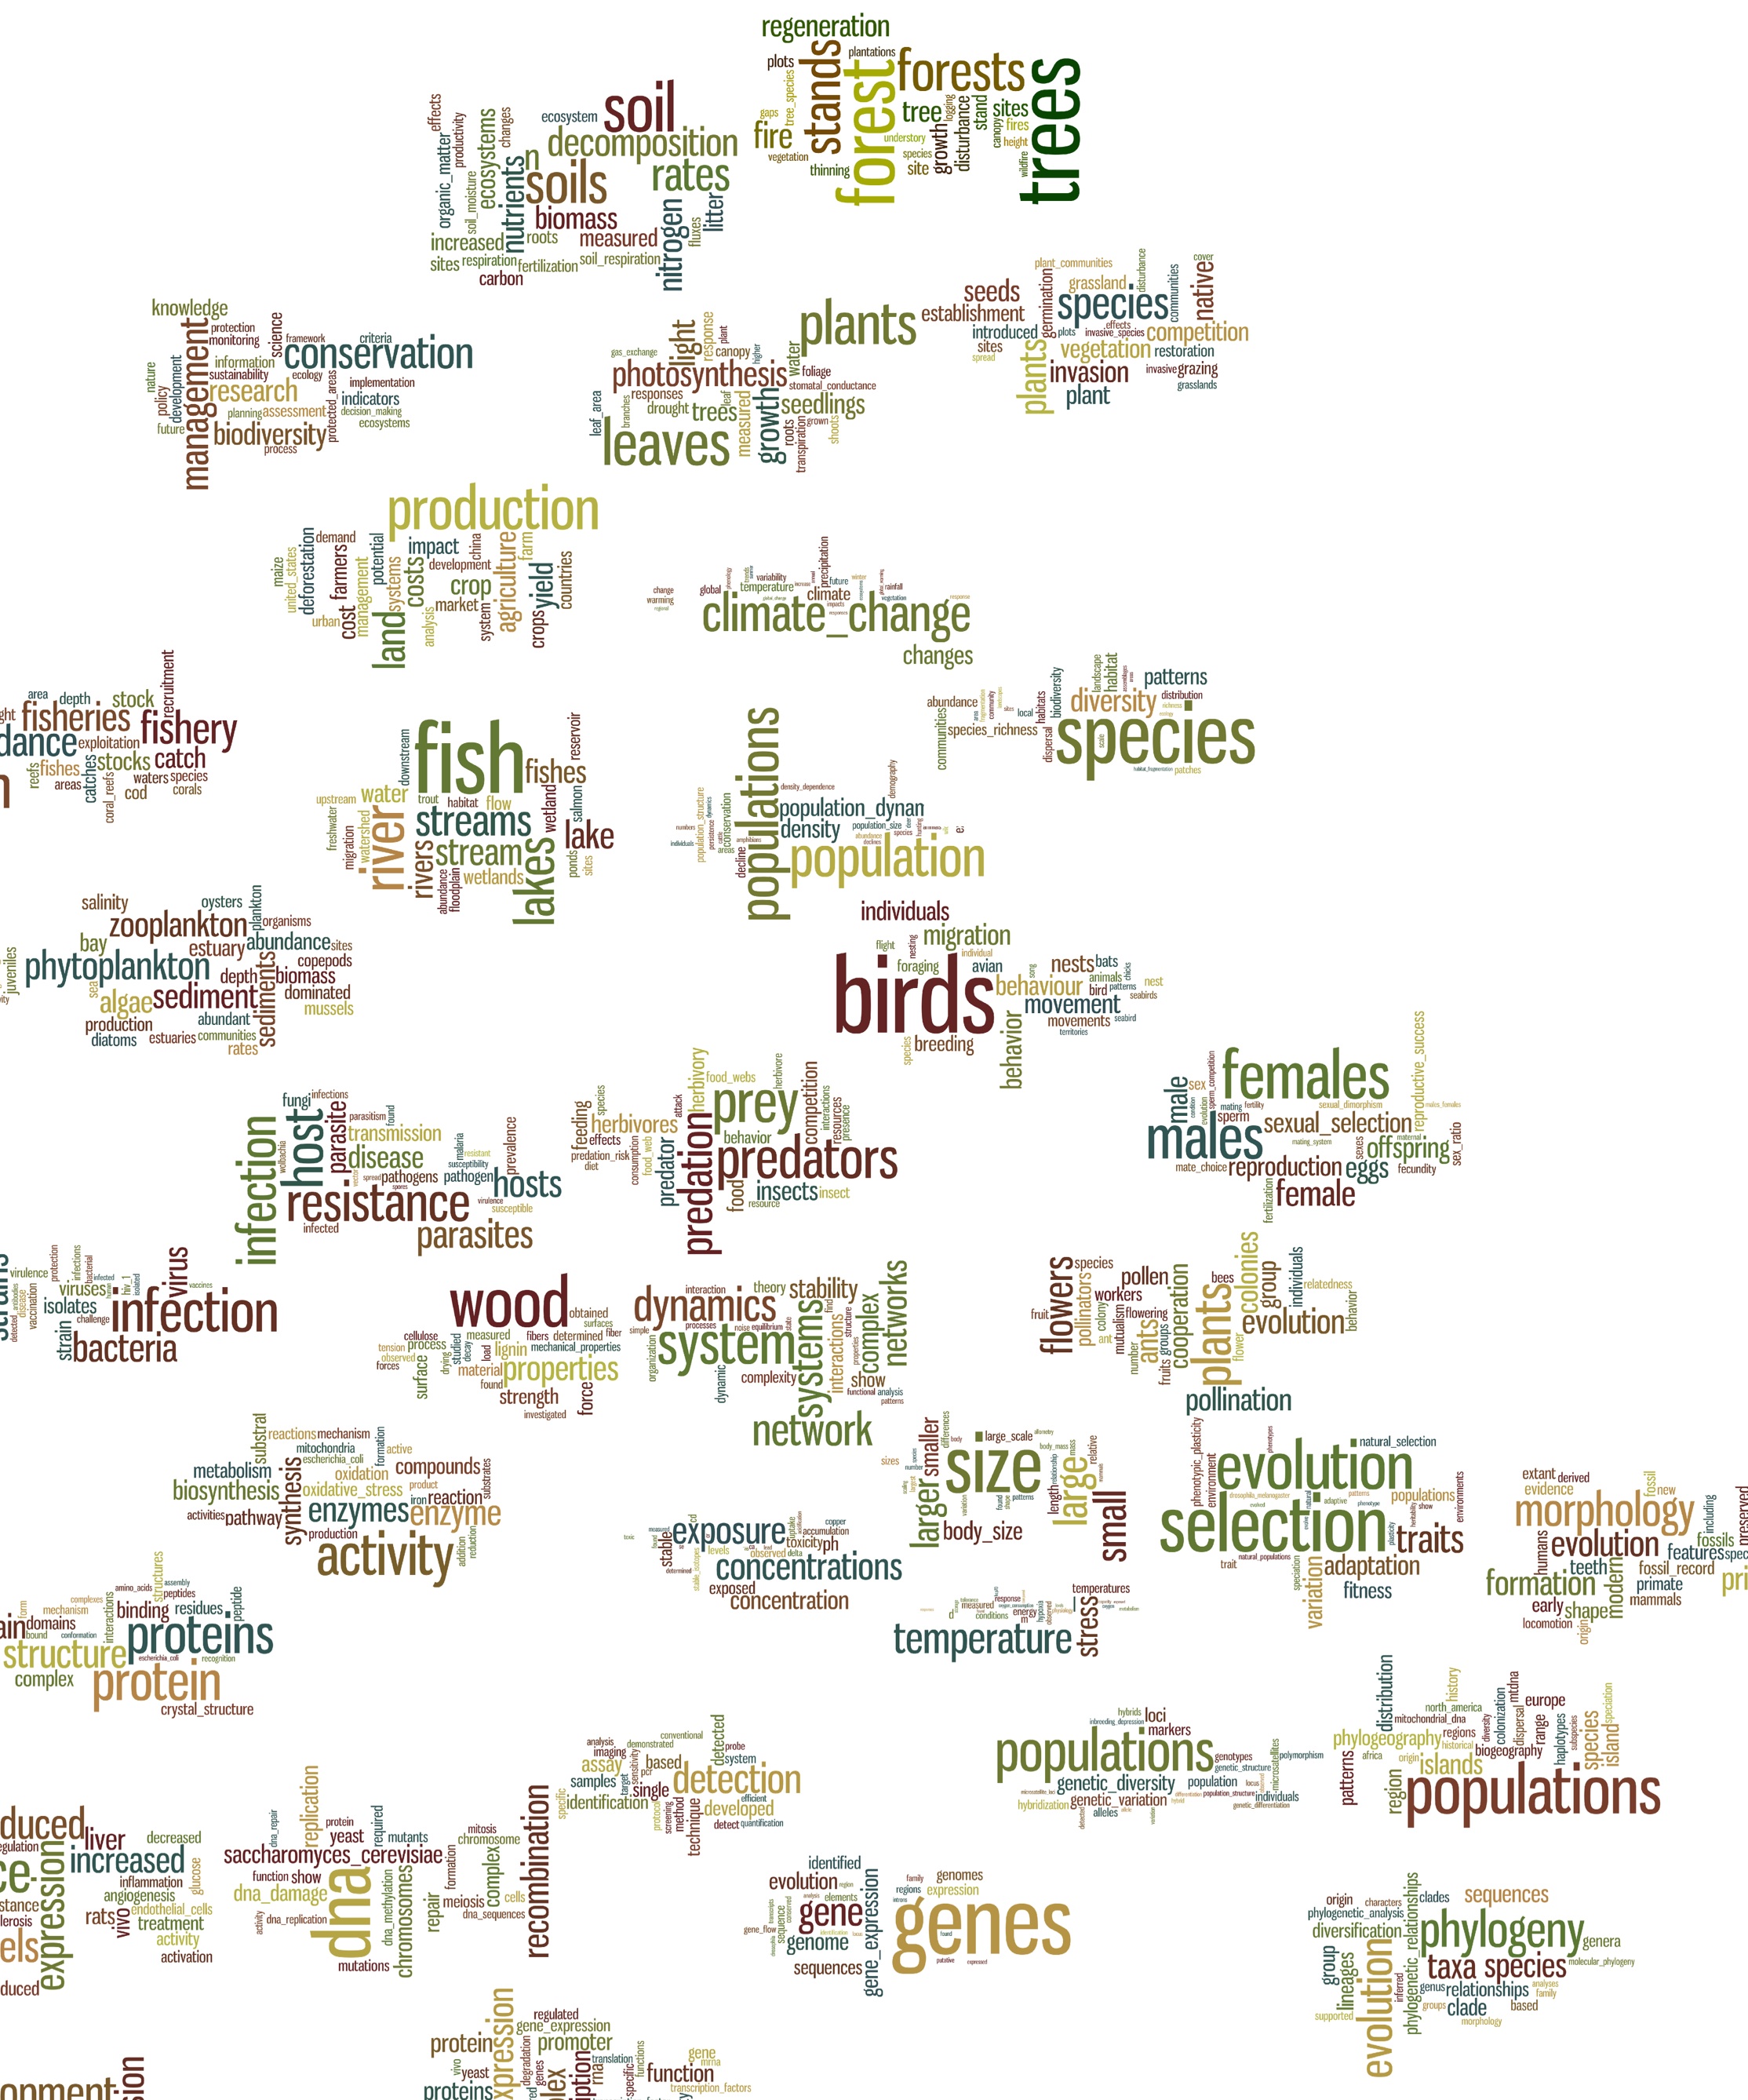
a few of the topics that emerged in our analysis
For this Roundtable, I will present a poster that I presented at the recent AAAS meeting in San Jose. The project is an outgrowth of a working group jointly supported by NCEAS and NESCent and led by Ed Hackett and John Parker. Please read the abstract below for a bit of background, and then come prepared to discuss how you think academic publications (including yours!) produced through synthesis center work might be measurably different from other publications in the field. Then we’ll see if your intuitions are supported by the data we have available. Prepare yourselves to either be really proud of your keen intuitions, or to be surprised by our results!
You can access the poster on figshare using this link: http://dx.doi.org/10.6084/m9.figshare.1314918
Update: To initiate discussion prior to the meeting, I’ve put a question up on Tricider, and I welcome you to use the link below to add your ideas, comment on others’ ideas, and/or vote on the ideas that have been suggested. The question is the following:
“How would you expect academic publications that report on synthesis research to differ from publications resulting from other research approaches?”
Here is the link:
http://www.tricider.com/brainstorming/35cVP1jgQRp
Synthesis is an emerging synthetic method for producing transformative research, and publications centers to promote synthesis are on the rise in the US and around the world. New analytic tools and techniques are needed to assess the originality and transformative potential of synthesis. We propose that research outputs produced within synthesis centers will exhibit distinctive qualities that distinguish them from other publications in their fields. To explore this possibility, we conducted a topical analysis of titles, abstracts, and keywords for approximately 400,000 articles published in 108 leading journals from the fields of Ecology, Evolutionary Biology, Biodiversity Conservation, Forestry, and Fisheries. We then described each document as a proportional combination of the discovered topics, and used the Rao-Stirling heuristics to estimate, for each document, various measures that illuminate contrasting aspects of diversity (i.e. variety, balance, and disparity). We then compare diversity metrics for the synthesis center documents with those for all other documents in our corpus to evaluate whether and how the measured diversity of synthesis center publications differs from that of other publications in the relevant fields.