
The Roundtable discussion on 8/17 included a presentation of the results of a survey on professional development interests and expertise that was sent out to the NCEAS community. (Thank you to everyone who filled out the survey!) During the discussion, we spent quite a bit of time delving into ideas about presentations or discussions related to areas of professional development that elicited high interest from the survey respondents.
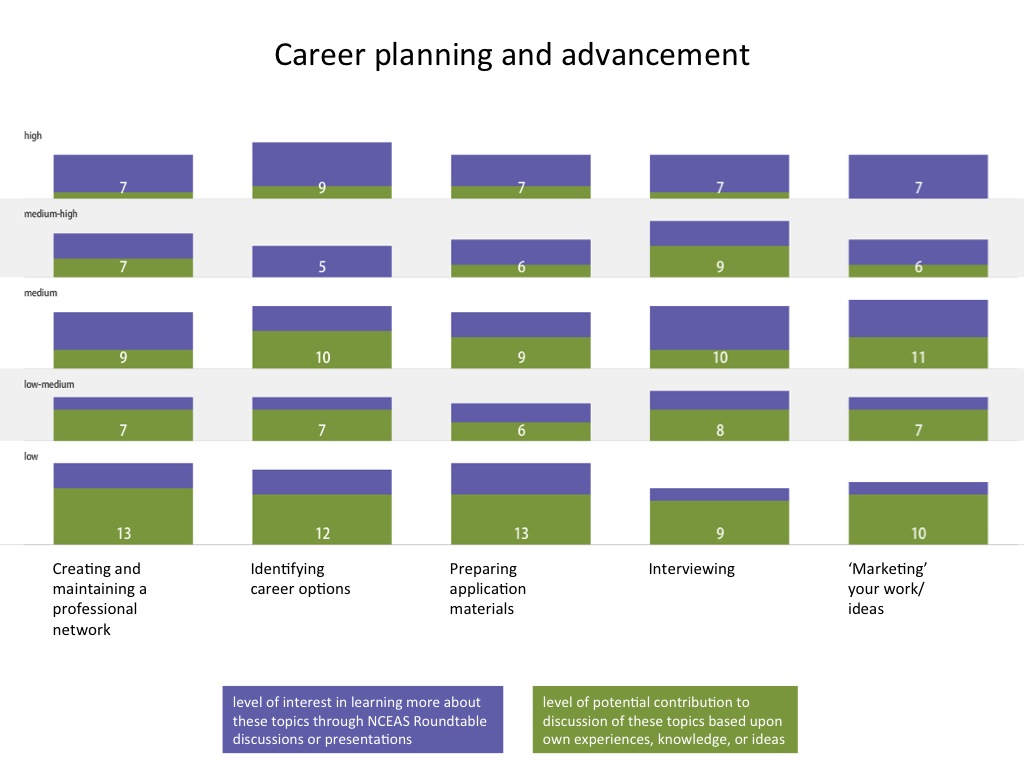
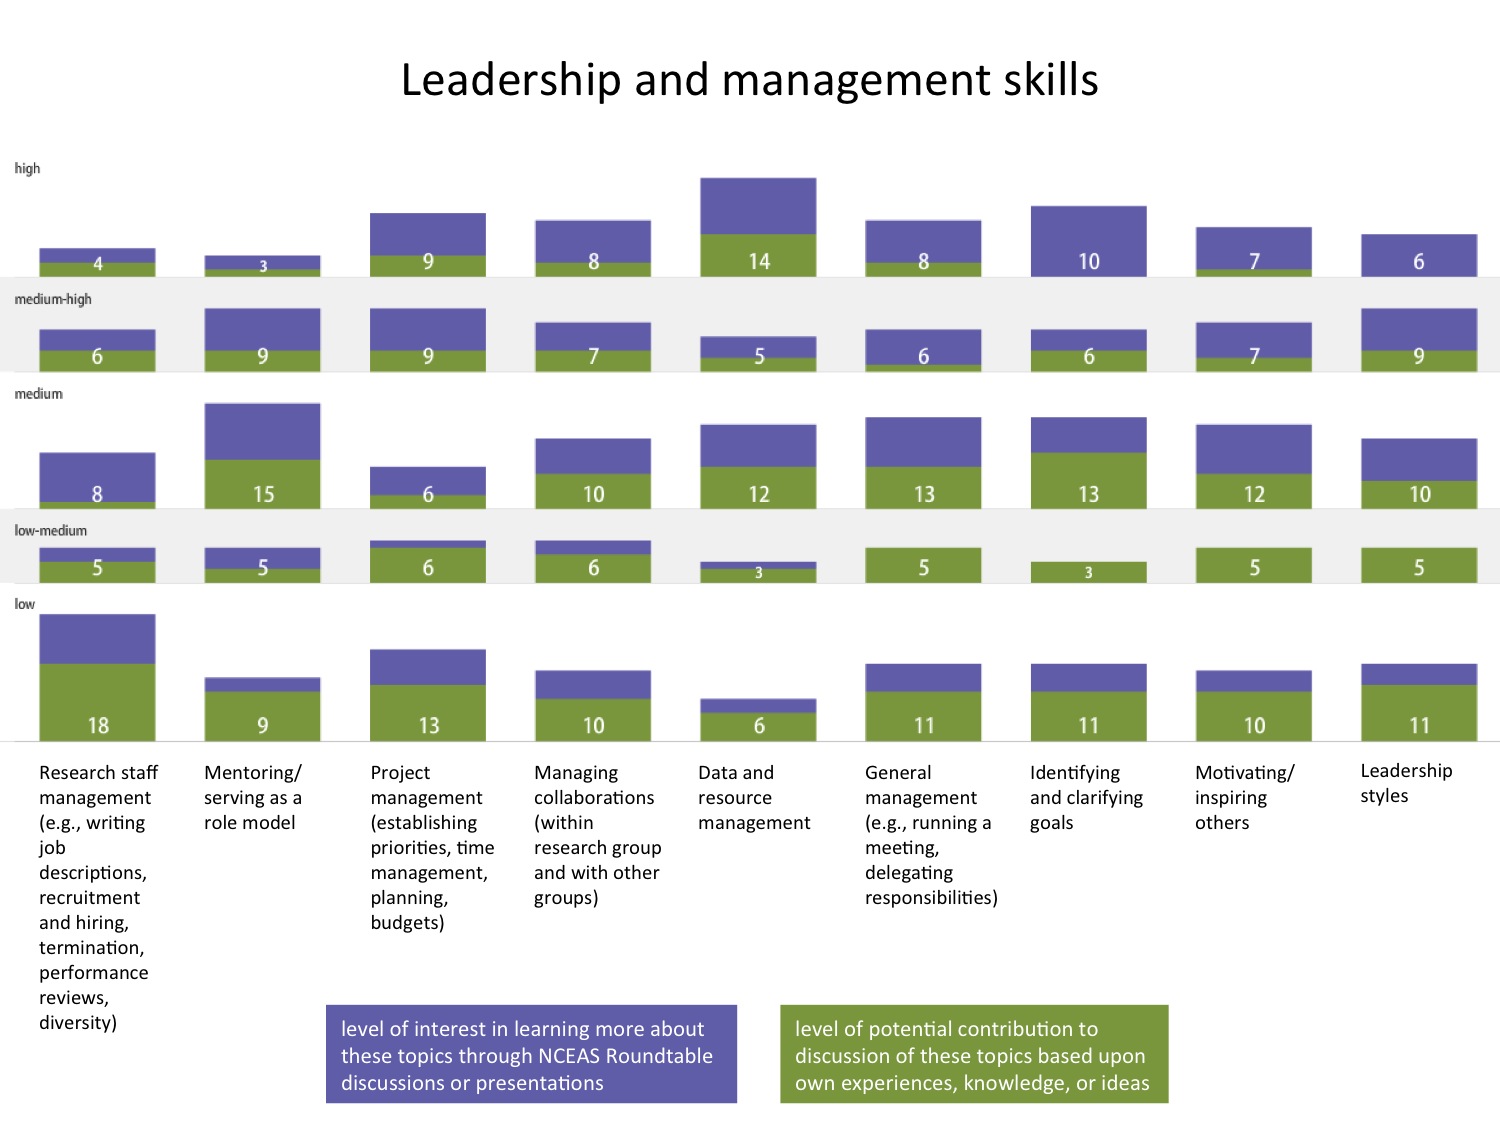
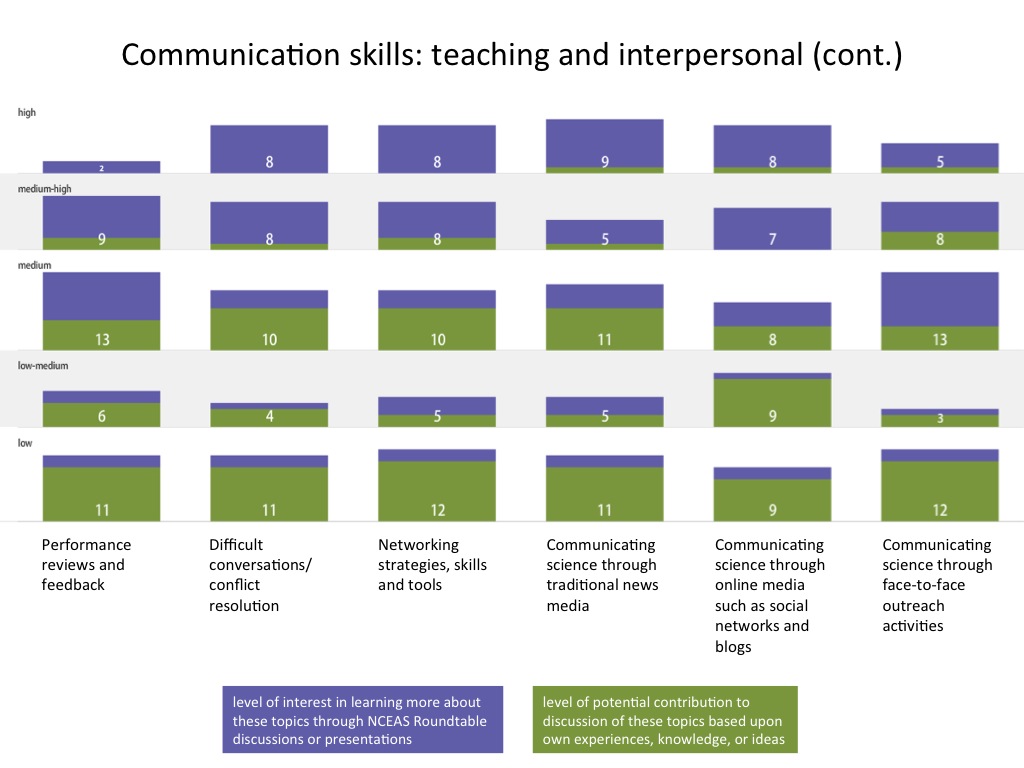
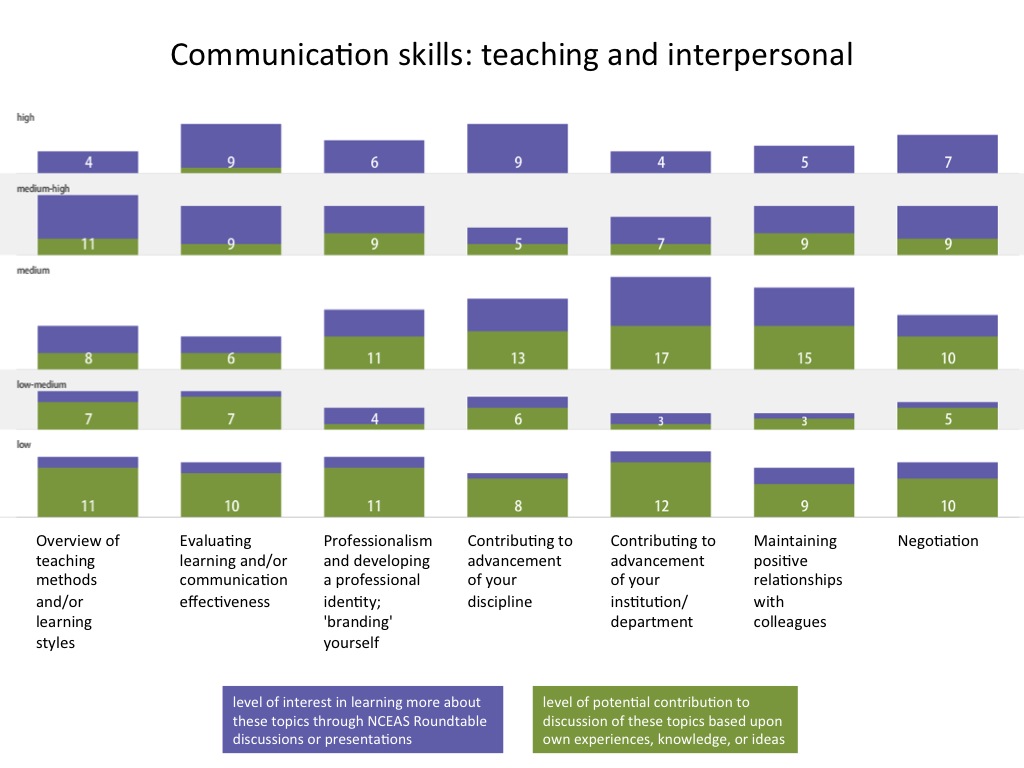
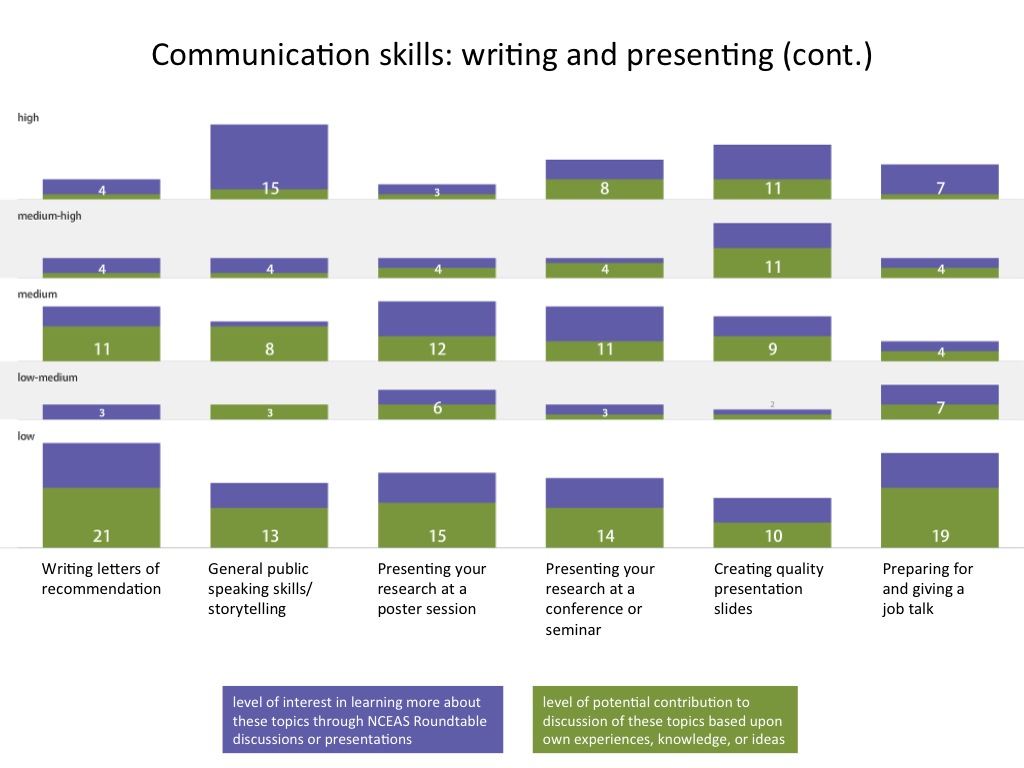
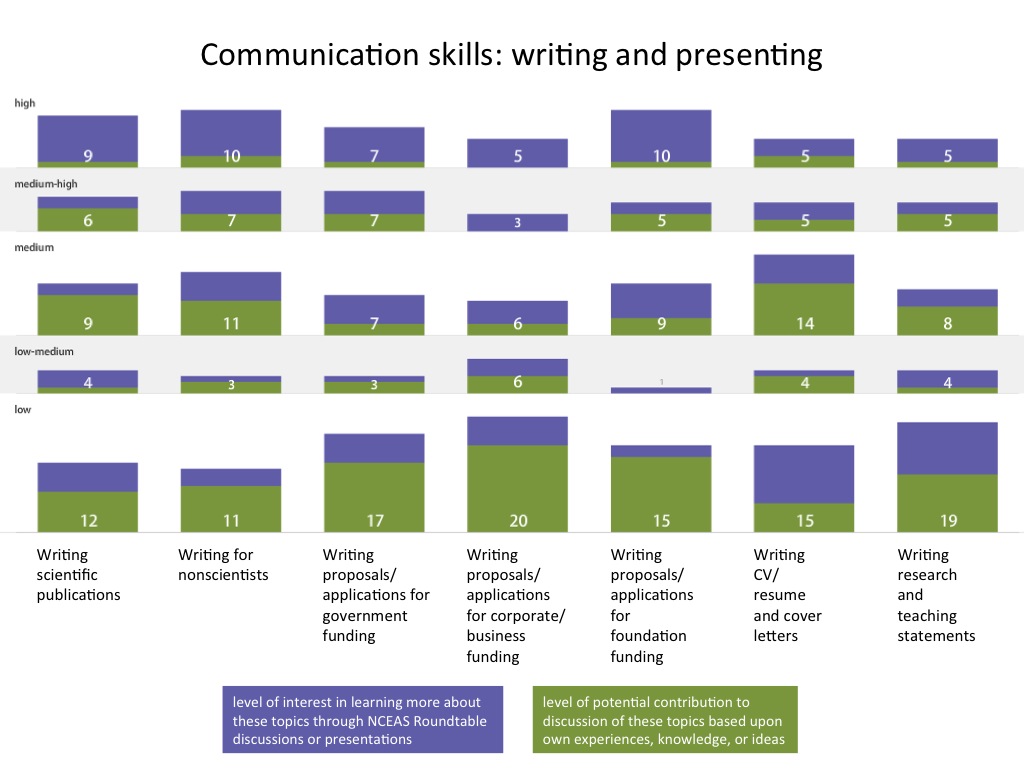
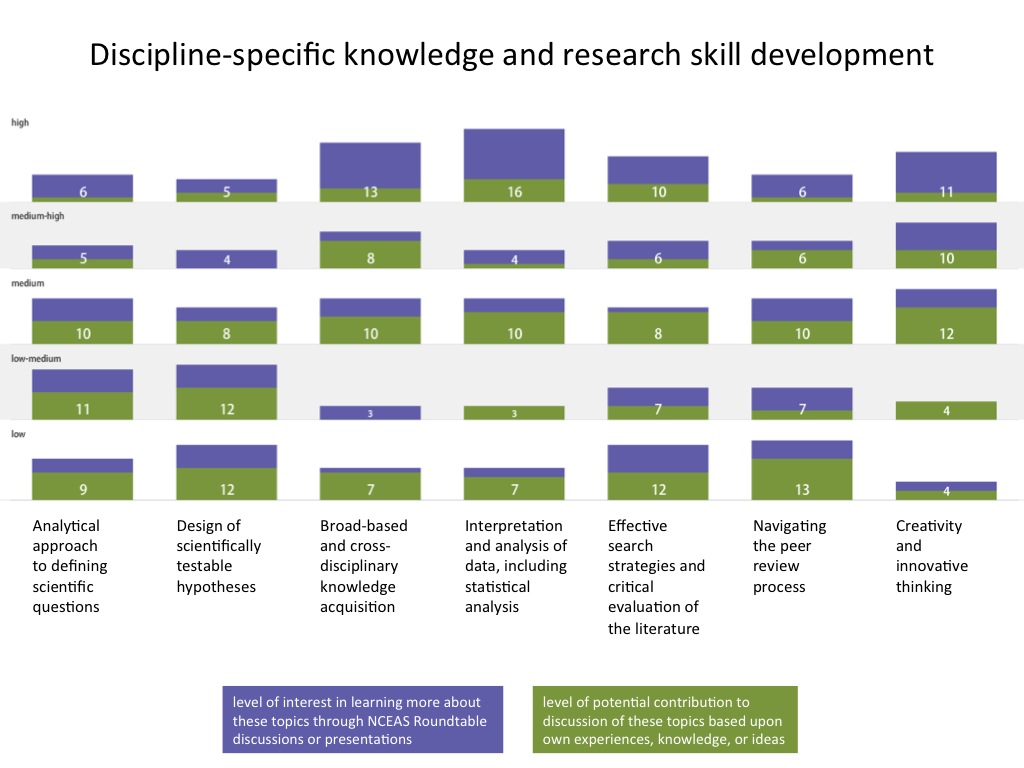
In the figures below, numbers of respondents who reported each level of interest and expertise are shown in the vertical, and different areas of professional development are listed from left to right. Purple segments represent level of interest, and green segments represent areas of expertise. Please let me know if you have any questions about how to interpret the figures.
-
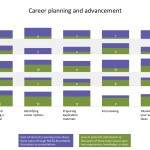
- Career planning and advancement
-
- Responsible conduct of research
-
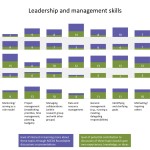
- Leadership and management skills
-
- Communication skills: teaching and interpersonal 2
-
- Communication skills: teaching and interpersonal 1
-
- Communication skills: writing and presenting 2
-
- Communication skills: writing and presenting 1
-
- Discipline-specific knowledge and research skill development
Several people suggested topics for discussion in addition to the ones included in the survey:
- dealing with sexism and other forms of discrimination in a professional setting
- data visualization
- how to resolve tensions between competition (me first) vs. collaboration/cooperation (us together) modes of advancing science
- enhancing cross-disciplinary communication
- framing research results
Some interesting readings were also mentioned during the discussion:
- On single vs. multiple hypothesis research: Platt JR. (1964) Strong Inference. Science 164 (3642), pp. 347-353.
- On the ‘two cultures’: Snow CP. (1960) The Two Cultures and the Scientific Revolution, Cambridge University Press.
- On writing: Gopen GD and Swan JA. (1990) The Science of Scientific Writing. American Scientist 78, 550-558.
Please add a comment below if you’d like to suggest additional topics or readings. I hope that these survey results will be helpful for those planning to host the Roundtable in the coming months.
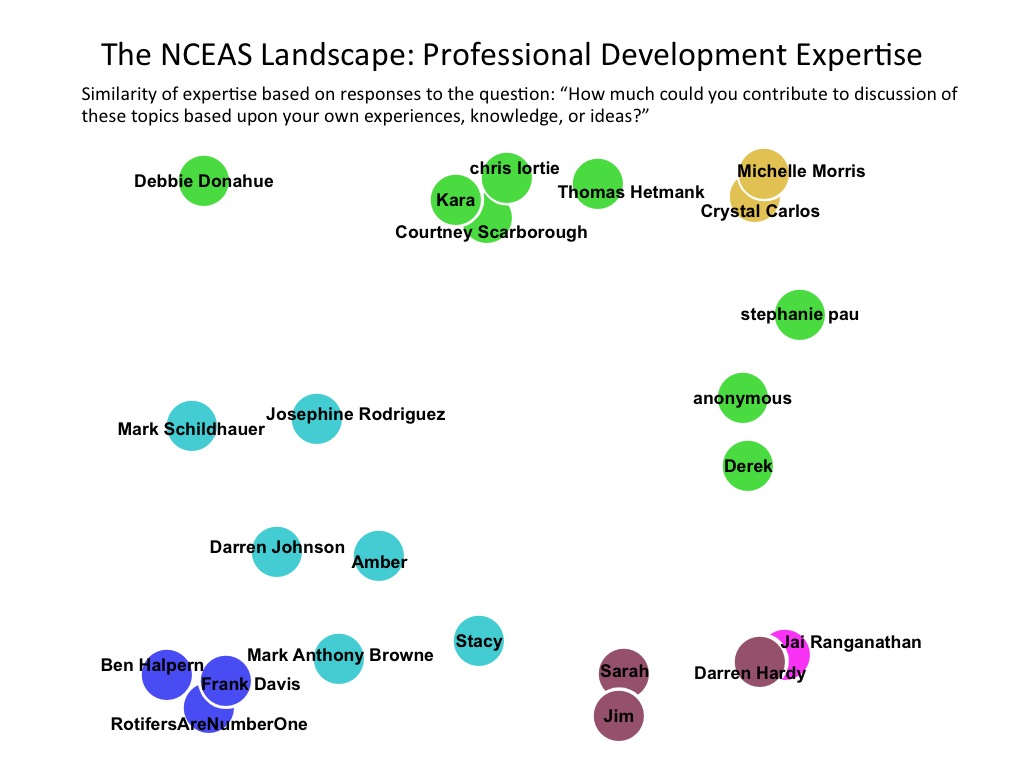
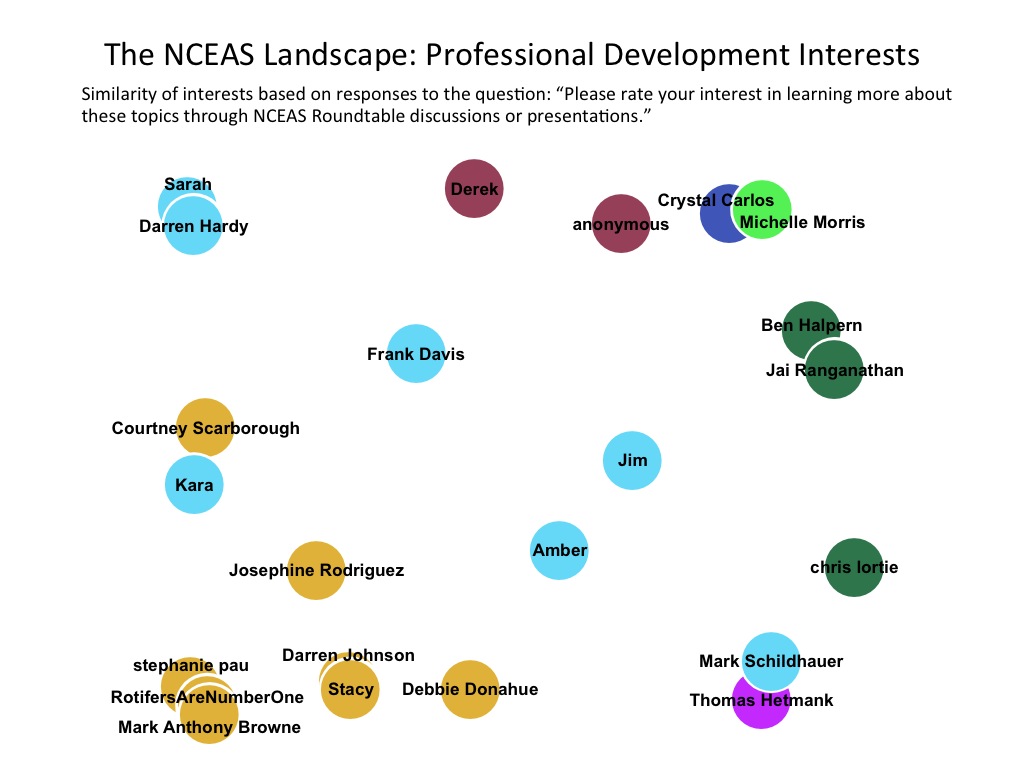
Just for fun, I also mapped out the survey participants based on shared interests and expertise using a self-organizing map (SOM) approach. The two images below show the results of this analysis. Colors represent cluster membership (k-means), and members of the same cluster can be expected to be more similar that members of different clusters.
-
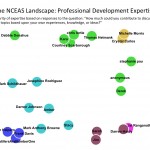
- The NCEAS Landscape: Professional Development Expertise
-
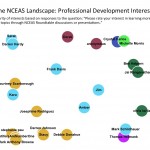
- The NCEAS Landscape: Professional Development Interests
See you at the next Roundtable!
*Wow, these SOMs are cool. How do you do these?
Thanks for the feedback, Chris!
The SOM approach was developed by Teuvo Kohonen, and his group developed a C++ implementation called SOM_PAK that is downloadable here. I then use SOMAnalyst to prepare the outputs for ArcGIS, where I create the visualizations.
I have Matlab scripts that implement the process from start to finish from .csv input. They’re a subset of the scripts available in the TextVisToolbox (TVT) I co-created to make topic modeling and text visualization easier. That has a lot of stuff you wouldn’t really need though, so email me if you’d like the subset used for this analysis. To run the scripts you will need Matlab running in a OSX (or Unix) environment, as well as ArcGIS and a compatible version of Python.