March 8th – GRNmap and GRNsight: Open Source Software for Dynamical Systems Modeling and Visualization of Medium-Scale Gene Regulatory Networks

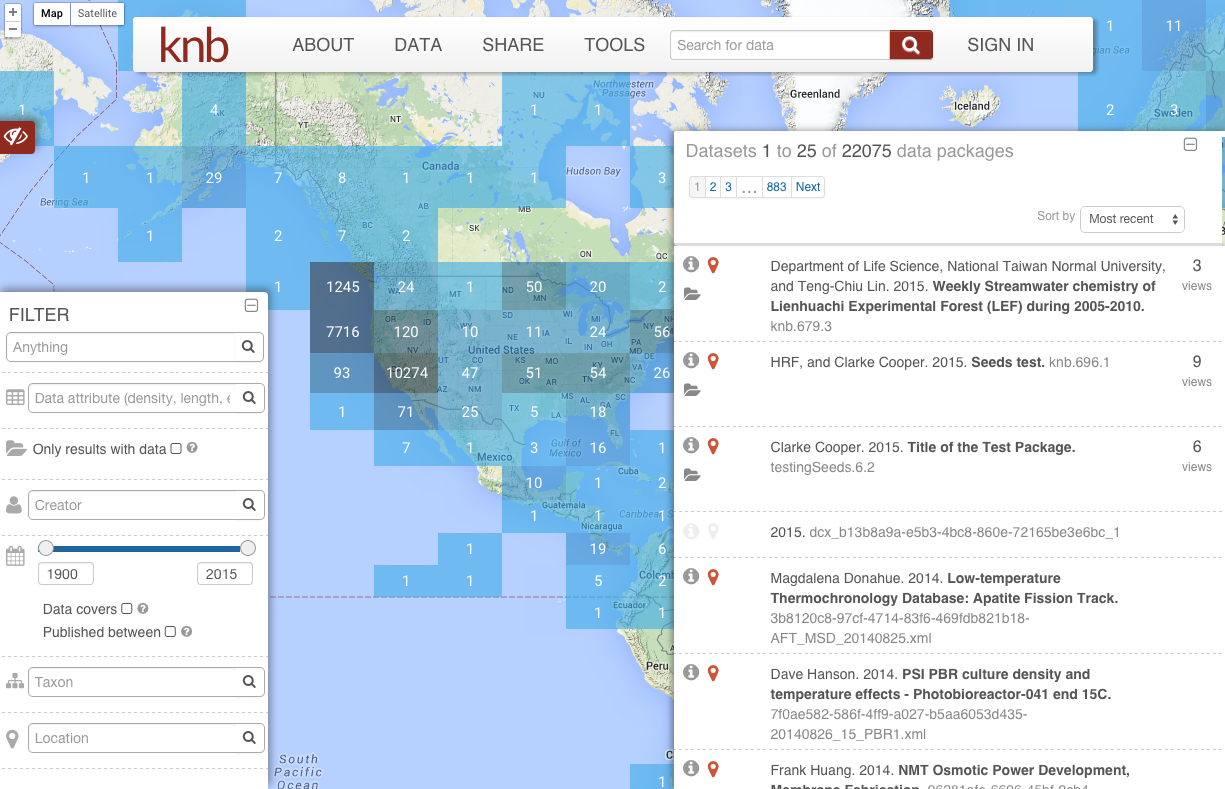
A gene regulatory network (GRN) consists of genes, transcription factors, and the regulatory connections between them that govern the level of expression of mRNA and proteins from those genes. Over a period of several years, our group has developed a MATLAB software package, called GRNmap, that uses ordinary differential equations to model the dynamics of medium-scale GRNs. The program uses a penalized least squares approach to estimate production rates, expression thresholds, and regulatory weights for each transcription factor in the network based on gene expression data, and then performs a forward simulation of the dynamics of the network using a sigmoidal or Michaelis-Menten production function. GRNsight is an open source web application for visualizing such models of gene regulatory networks. GRNsight accepts GRNmap- or user-generated Excel workbooks containing an adjacency matrix representation of the GRN, SIF, or GraphML files and automatically lays out the graph of the GRN model. GRNsight’s diagrams are based on D3.js’s force graph layout algorithm, which was then extensively customized. GRNsight uses pointed and blunt arrowheads, and colors the edges and adjusts their thicknesses based on the sign (activation or repression) and magnitude of the GRNmap weight parameter. Visualizations can be modified through manual node dragging and sliders that adjust the force graph parameters. In addition to discussing how these efforts have contributed to our understanding of the gene regulatory network controlling the response to the environmental stress of cold shock in budding yeast, Saccharomyces cerevisiae, I will put them in the context of an Open Science Ecosystem, in which the process and products of science are open and accesible to all. Together, the life cycle of these two programs illustrate the differences between the cultures of biology, mathematics, and computing, the challenges and benefits of bringing an existing code base up to open development standards (GRNmap), and the advantages of starting a project using best practices from the beginning (GRNsight). Our goal is to facilitate reproducible research.

Seaver College of Science and Engineering Faculty Staff Headshots

Dr. Kam Dahlquist is an Associate Professor of Biology and Affiliate Faculty of the Bioethics Institute at Loyola Marymount University. Dr. Dahlquist earned a B.A. in Biology from Pomona College and a Ph.D. in Molecular, Cellular, and Developmental Biology from the University of California, Santa Cruz. Dr. Dahlquist performed postdoctoral research at the Gladstone Institute of Cardiovascular Disease at the University of California, San Francisco, and taught for two years at Vassar College before joining the LMU faculty in 2005. In her research, Dr. Dahlquist follows an interdisciplinary approach to understanding gene regulatory networks that involves cutting-edge techniques in genomics, mathematical, and computational biology. This research crosses over into her teaching in such courses as Molecular Biology of the Genome, Biomathematical Modeling, Biological Databases, and Bioinformatics Laboratory. She believes that her research and teaching must be informed by and contribute to a broader social context. She has worked with various groups such as the UCSF Science and Health Education partnership and the Association for Women in Science (AWIS) to improve science education for all and to increase the numbers of women and minorities in science. She believes strongly in training her students to apply ethical standards to the conduct of scientific research. Finally, she promotes an Open Science Ecosystem in which the process and products of science are open and accessible to all.

kdahlquist@lmu.edu

Measuring the status of fisheries and factors leading to success

This talk will summarize the results to date of our SNAPP group of the same title.  We will summarize the data we have available on the status of fish stocks,  and how they are managed.
We now have reliable data from national and international scientific institutions on stocks constituting over 50% of global fish catch, with Asia south of Japan the major area that is not covered.  We also have less reliable estimates from  statistical models of most fisheries not covered by scientific assessments.  We have also collected data on how fisheries are managed in major fishing countries and international fisheries.  Our best estimates are that globally fish stock abundance has been stable for the last several decades,  but increasing in places were good scientific data are available and likely decreasing where such data is not available.  Our preliminary results suggest that there is not a strong relationship between the intensity of fisheries management and stock status because intensive management seems to result from poor stock status.  If we focus on stocks that are overfished then a clear relationship between intensity of management and stock recovery emerges.
At our current meeting we are asking two key questions.  (1) what factors have led to recovery of overexploited species and (2) Does science advice improve fisheries outcomes.
Speakers:
Ray Hilborn
Mike Melnychuk
Maite Pons
Ray Hilborn

Ray Hilborn

Ray Hilborn is a Professor in the School of  Aquatic and Fishery Sciences, University of Washington specializing in natural resource management and conservation. He  teaches graduate and undergraduate courses in food sustainability, conservation and quantitative population dynamics.  He authored several books including “Overfishing: what everyone needs to know” (with Ulrike Hilborn) in 2012,  “Quantitative fisheries stock assessment” with Carl Walters in 1992, and “The Ecological Detective: confronting models with data” with Marc Mangel, in 1997 and has published over 300 peer reviewed articles.  He has served on the Editorial Boards of numerous journals including  7 years on the Board of Reviewing Editors of Science Magazine.    He has received the Volvo Environmental Prize, the American Fisheries Societies Award of Excellence, The Ecological Society of America’s Sustainability Science Award,  and the International Fisheries Science Prize.    He is a Fellow of the American Fisheries Society, the Washington State Academy of Sciences, the Royal Society of Canada and the American Academy of Arts and Sciences.
mikem2
Mike Melnychuk is a Research Scientist at the University of Washington’s School of Aquatic and Fishery Sciences, working with Ray Hilborn. His research focuses on characterizing the variability in fisheries management systems around the world and assessing the consequences of that variability for fish stocks and fisheries. In previous lives, Mike completed his PhD at UBC with Carl Walters and Villy Christensen, studying migration and mortality patterns of juvenile salmon, and then completed a post-doctoral fellowship at UW with Tim Essington, quantifying ecological impacts of catch share fisheries.
img_5820
Maite Pons is a PhD. student working with Ray Hilborn in the School of Aquatic and Fishery Sciences, University of Washington. She is originally from Uruguay where she completed her undergrad in biology and masters in ecology. Her research focuses in stock assessment and management of large pelagic species such as tunas and billfishes. She is interested not only in the performance of different assessment models but also in how different management measures impact current stock status.
As usual, Roundtable will take place in the NCEAS lounge at 735 State Street, Suite 300.
OR Join us virtually by connecting to
Or dial in using your phone. United States : +1 (408) 650-3123
Access Code: 653-578-053

Introduction to Jupyter notebooks and quick dive into Python

Presenter: Julien Brun

Jupyter notebooks are a great way to share your data analysis and promote reproducible science.  These interactive notebooks mix executable computer code (e.g. Python, R, Julia, Bash, …) with rich text and data visualizations. Have a look here for some examples: https://nbviewer.jupyter.org. We will use this tool to do a quick dive into Python with specific tips for R users.

Note that the hands-on participation is space-limited and you need to register here. However, everybody is welcome to follow the session in person or remotely. The hands-on participants  will need to bring their laptop to connect to NCEAS’ server, but no specific installation is required.

Interactive Tradeoffs to Support Anticipatory Marine Spatial Planning [Wed. Sept.14]

Human use of the oceans is increasingly in conflict with conservation of endangered species. Evaluation of environmental impacts have historically been post hoc; the time and place of human activity is often already proposed before assessment. I describe anticipatory spatial decision support frameworks that highlight tradeoffs between industry and conservation with interactively synchronized map and tradeoff plots for two spatially distinct problems: siting for offshore wind energy development (OWED) and routing for ships to avoid striking whales.

Offshore wind energy development suffers from a lengthy environmental compliance process, estimated to incur a 7 to 10 year permitting timeline in the US. To responsibly and expeditiously evaluate environmental impacts we differentially assess sensitivity of wildlife above the water line in space, and below the water line in time. During long-term OWED operation, birds can collide and be displaced by active turbines. During episodic pre-operation phases, cetaceans are most heavily impacted acoustically by seismic airgun surveys and pile driving. The framework highlights sites in space that are most profitable and least sensitive to birds. For a given site, pre-operation activities are advised by cetacean sensitivity across months of the year that minimize impacts on migratory cetaceans, particularly those of highest conservation concern such as the North Atlantic right whale (Eubalaena Glacialis) in the case of the US Mid-Atlantic study area.

For routing ships to avoid whale strikes, British Columbia is evaluated in light of potential new oil tanker traffic to Port Kitimat where an oil pipeline terminal is under consideration. Marine mammal species distributions are aggregated to a single map layer, weighted by species conservation concern. This map layer of risk to species acts as the resistance surface by which least-cost routing is implemented. Transformations are applied to this surface before the routing algorithm for providing a series of routes offering a range of tradeoffs between conservation and industry. Preemptive avoidance of whale hotspots by ships could theoretically become as commonplace in the oceans as traffic avoidance by cars with Google Maps.
The web-based interfaces are built using the open-source, cross-platform R package shiny. Future developments and broader applications will be discussed.


Ben Best is an environmental data scientist with a strong background in marine spatial ecology. He offers consulting services, current clients of which include the Ocean Health Index and Marine Biodiversity Observation Network. He has lectured at UCSB’s Bren School of Environmental Science & Management for several courses (GIS, Advanced GIS, Landscape Ecology, Environmental Informatics) as well as Duke University’s Nicholas School of the Environment (Marine GIS). He was previously employed as a senior analyst for the Ocean Health Index and research associate for development of the OBIS-SEAMAP marine animal observation geoportal. He recently completed a PhD at Duke University’s Nicholas School from the Marine Geospatial Ecology Lab and obtained an MS in Environmental Sciences from Duke, and from UCSB a BS in Aquatic Biology and BA in Geography.


bbest_pic

Ben Best, Ph.D.
bbest@nceas.ucsb.edu

Introduction to Marxan (hands on tutorial) [Wed. May 25]

Systematic conservation planning is the science of understanding which conservation interventions to enact, and when and where to do them given limited conservation budgets and the diverging needs of different stakeholders. This approach is fundamental to modern evidence-based conservation. In this workshop we’ll learn about the fundamental principles of systematic conservation planning, and discuss some examples of where it has been applied. This will be concreted with some simple tutorials using Marxan.

Claire

Claire Runge
runge@nceas.ucsb.edu
twitter: @Claire_Runge

An Overview of DataONE: Services, resources and future activities [Wed. April 13]

The Data Observation Network for Earth (DataONE) is an NSF-supported DataNet project which is developing a distributed framework and sustainable cyberinfrastructure to meet the needs of science and society for open, persistent, robust, and secure access to well-described and easily discovered Earth observational data. Now in its seventh year of funding, DataONE has released a number of tools, services and programs that support users in their data management, discovery, preservation and education needs. This overview will provide a brief history of DataONE, its guiding principles and showcase the tools and services available to the community. I will also summarize the education and outreach activities of the project and the opportunities for community participation.

DataONE

Amber Budden
Director for Community Engagement and Outreach
DataONE
aebudden@dataone.unm.edu


Workshop: Vector spatial data in R [Wednesday February 10]

Next week’s event will be a workshop, not a roundtable. The workshop will be led by Casey O’ Hara at NCEAS. We will have facilities for remote participation for those who’d like and/or if we run out of space at the NCEAS conference room.
Please RSVP to attend and get follow-up emails.
Vector spatial data in R

GIS is a useful tool for viewing spatial data and creating maps, but R can do a lot of the heavy lifting when it comes to analyzing your spatial data.  We will focus on vector spatial data in this workshop (polygons, lines, points) but also touch on raster spatial data, building upon the raster workshop led by Jamie last fall.  Please RSVP by filling out this google form, so we can send you a follow up e-mail with further instructions to set up your laptop.  Newbies and experts are all welcome.

 
Some things we will look at; if you have specific questions please feel free to send them in advance (e-mail or on the RSVP form):

  • reading and writing vector spatial data (shapefiles and geodatabases)
  • projecting and displaying vector spatial data (incl. mapping in ggplot)
  • understanding the structure of R spatial polygon objects so we can take them apart, analyze them, modify them, and put them back together again.
  • using basic geoprocessing tools in R to manipulate geometry, e.g. intersect, difference, area, buffer, etc.
  • working with polygons and rasters together
  • checking and repairing geometries (beware of orphan holes!)

Please bring a laptop if you can, so we can work through the examples together.  You can find the materials (scripts, data, and workshop notes) here: https://github.com/eco-data-science/spatial_analysis2_R.  Clone or fork the repository (if you’re a GitHub person) or download the zip file (button on right, above the list of files).

We’ll send a followup e-mail to attendees with a to-do list of things to set up ahead of time, including software and R packages you might need to install or update.  Please make sure to RSVP!

Open Science with the Ocean Health Index [Nov 18, 2015]

The Ocean Health Index (OHI) is a framework to assess the state of our marine systems. With a definition of ‘healthy’ that includes sustainable human use, the OHI scores locations from 0-100 depending on how sustainably their waters provide a suite of benefits to people. The OHI framework was first used to assess all coastal nations globally, and was published in 2012 (Halpern et al. 2012, Nature).
Following the 2012 publication, the OHI framework has been used to assess smaller-scale locations, most often states or provinces within a single nation. These smaller spatial scales often have information that better represents local characteristics of marine systems and are also often the scale at which policy decisions are made.
To date, eleven assessments using the OHI framework have been completed at global, national, and regional scales, four of which have been led by independent academic or government groups. To facilitate these assessments, we have developed a suite of open-source tools and instruction. The OHI Toolbox provides structure for data organization and storage, with data processing and goal modeling done in the programming language R and RStudio for reproducibility and repeatability. The OHI Toolbox is stored on the open-source online platform GitHub, which allows for transparency and collaboration and also houses websites to display and communicate methods and results with interactive visualizations. More information can be found at ohi-science.org (currently under a major restructuring and improvement, stay tuned!).
Julia Stewart Lowndes, PhD
Project Scientist, Ocean Health Index
National Center for Ecological Analysis and Synthesis (NCEAS)
University of California, Santa Barbara (UCSB)
735 State Street, Suite 300
Santa Barbara, CA, 93101, USA
ohi • ohi-science • github • twitter
JL_Pic

KNB data search tool demonstration

UPDATE: Here are the links Lauren mentioned in her talk.

Slides: https://docs.google.com/a/nceas.ucsb.edu/presentation/d/1zdZLh3YRIXWsxXFNuo1c6N7hqgbn_KFzL9_ztPm1HC4/edit?usp=sharing
Provenance/Workflow dataset: http://search.test.dataone.org/#view/urn:uuid:bf71c38b-22b2-469e-8983-734ec0ab19cb
KNB: https://knb.ecoinformatics.org/#data/page/0
Download Morpho: https://knb.ecoinformatics.org/#tools/morpho
R DataONE library: https://releases.dataone.org/online/dataone_r/

We have a great tech roundtable on May 27!

Lauren Walker, a programmer based at NCEAS, will be leading an informal demonstration of the KNB: Knowledge Network for Biocomplexity, an international data repository and DataONE member node. She will demonstrate how to submit a dataset to the KNB via an online tool and through the DataONE R client.

She will also give a demonstration of the DataONE online search interface, which queries all 24 DataONE member nodes, using the same web software as KNB. This will include a preview of the upcoming scientific data provenance features in DataONE.

Lauren will open the roundtable up for feedback, suggestions, and to hear what you would find most useful with these kinds of tools.

knb


EVOS/GoA data projects: challenges and successes

Ever wonder that the Gulf of Alaska projects are and why we care about such a specific region here at NCEAS? Come find out at the next NCEAS roundtable! I will give a brief overview of the Gulf Watch Alaska Project and the role NCEAS has played in the ecological research up there.

Data archiving and maintenance was rather prehistoric in the 1980s when the Exxon Valdez oil spill occurred in Price William Sound. Therefore, wrangling historic data in “the last frontier” has proven to be quite the adventure! Our group will be writing two papers based on our experiences: 1) data recovery and archiving and 2) data collection for synthesis work . I’ll be introducing these papers and asking for feedback and suggestions on direction, format, etc. Hope to see you there!

Jessica_rdtablepic


Jessica Couture, MS
National Center for Ecological Analysis & Synthesis
University of California, Santa Barbara
couture@nceas.ucsb.edu